StratMap is the property portfolio tracker and modelling tool for Australian investors. See your position in one place, project it 30 years under 2026 tax rules, compare strategies side by side and see the numbers behind a purchase. First-timers model an opening purchase. Established investors compare scenarios and reports.
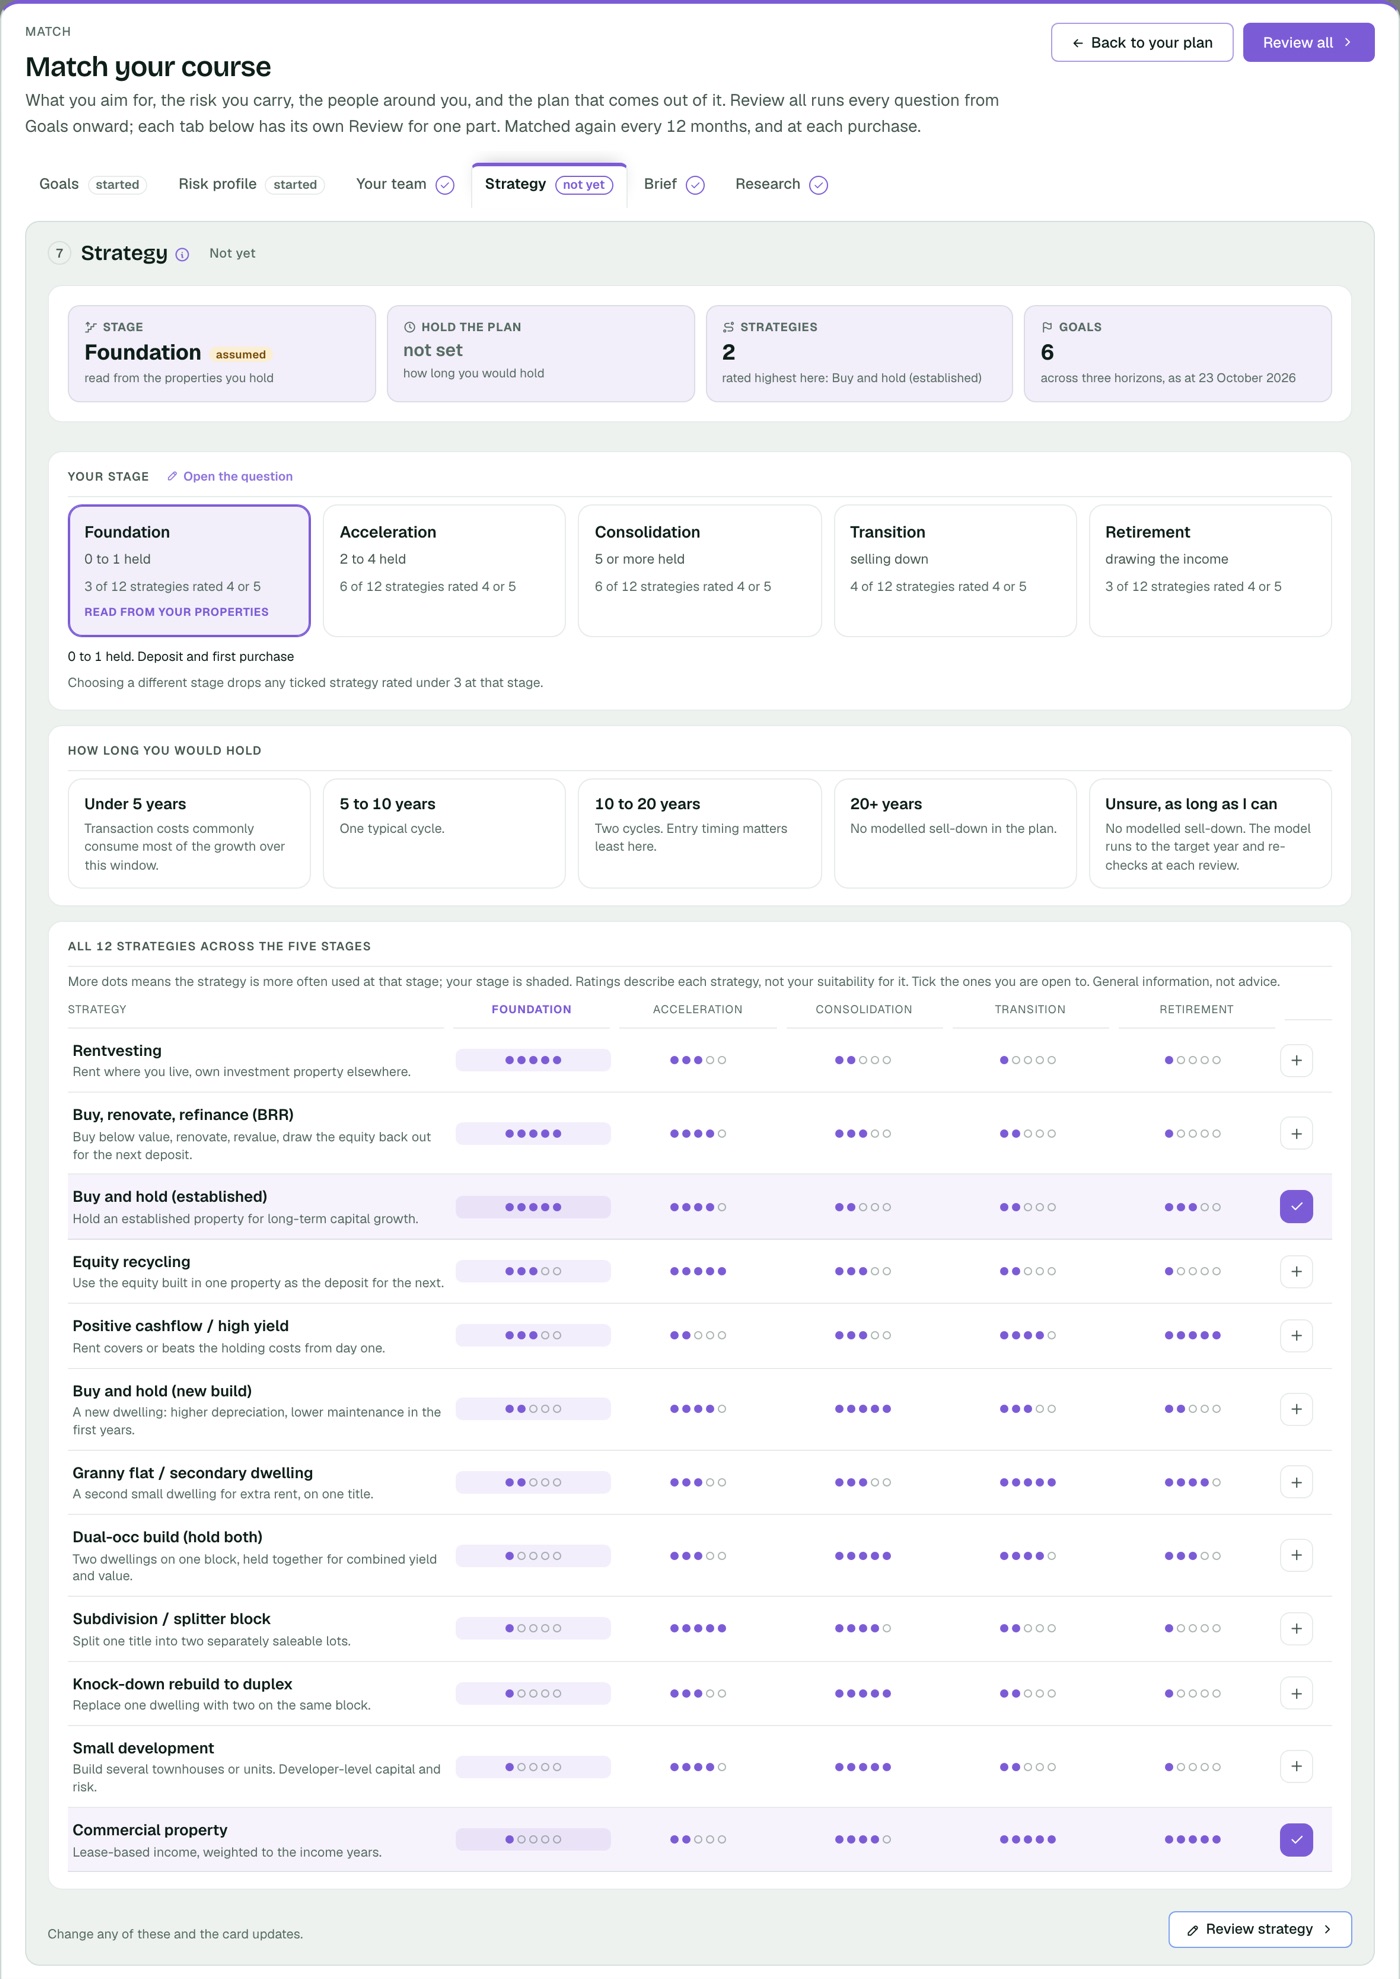
The model reads your property count and shows what each stage asks of your numbers: deposit, borrowing, equity and income. It describes the stages. It does not tell you which move to make.
Deposit and a first purchase. Model the deposit, the duty and the borrowing test as numbers before you commit.
Equity recycled into the next purchase. See usable equity, how each purchase is funded and the year it clears the borrowing test.
Growth does the work and loan to value falls. Compare holding costs, debt reduction and a commercial entry.
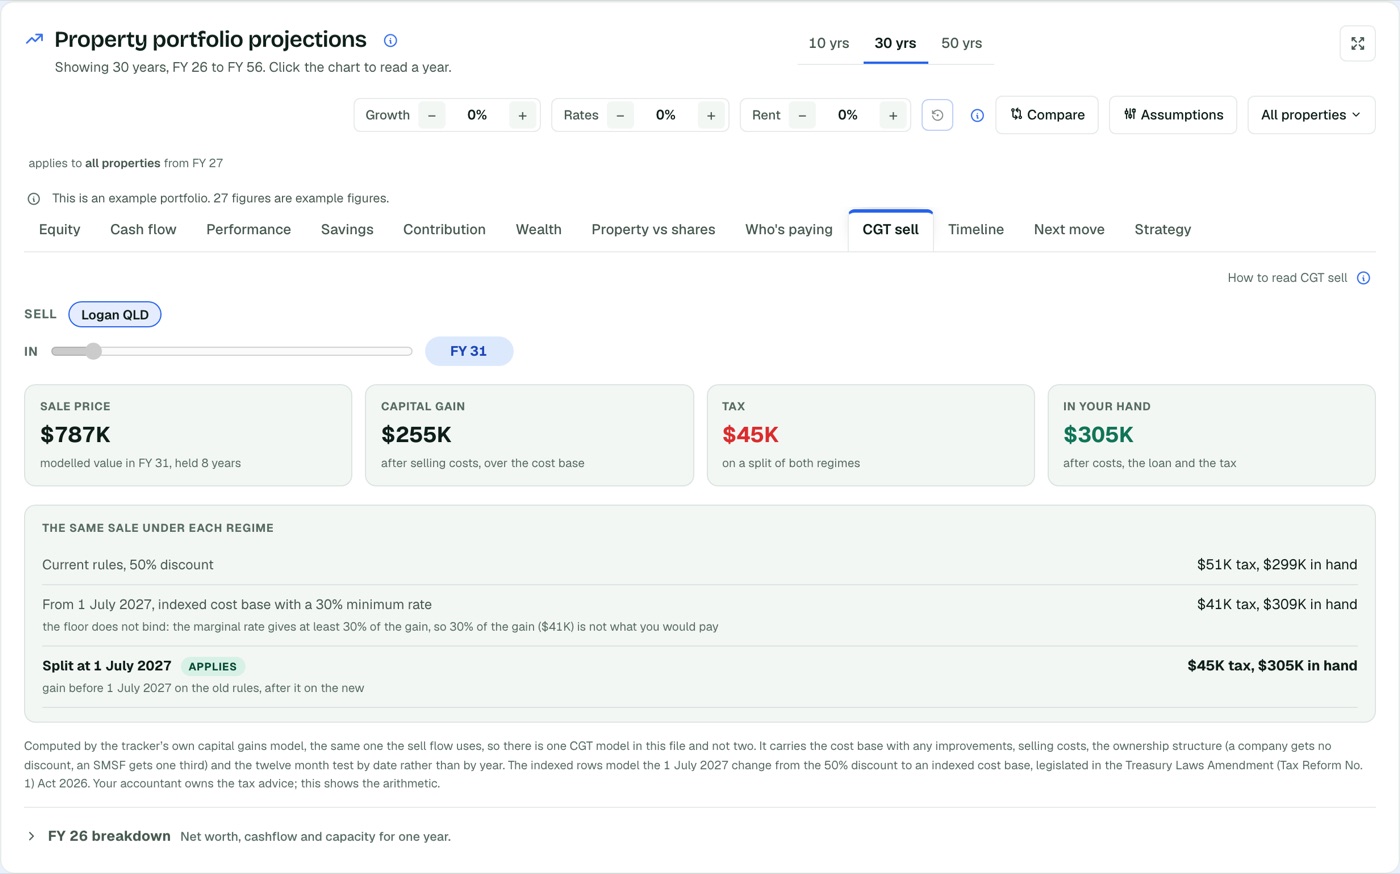
Compare a sale under each capital gains method and the income left after tax.
The after tax income against your goal, and the year it lands at your inputs.
Stage names describe the model's inputs. Ratings describe each strategy, not your suitability for it. General information only.
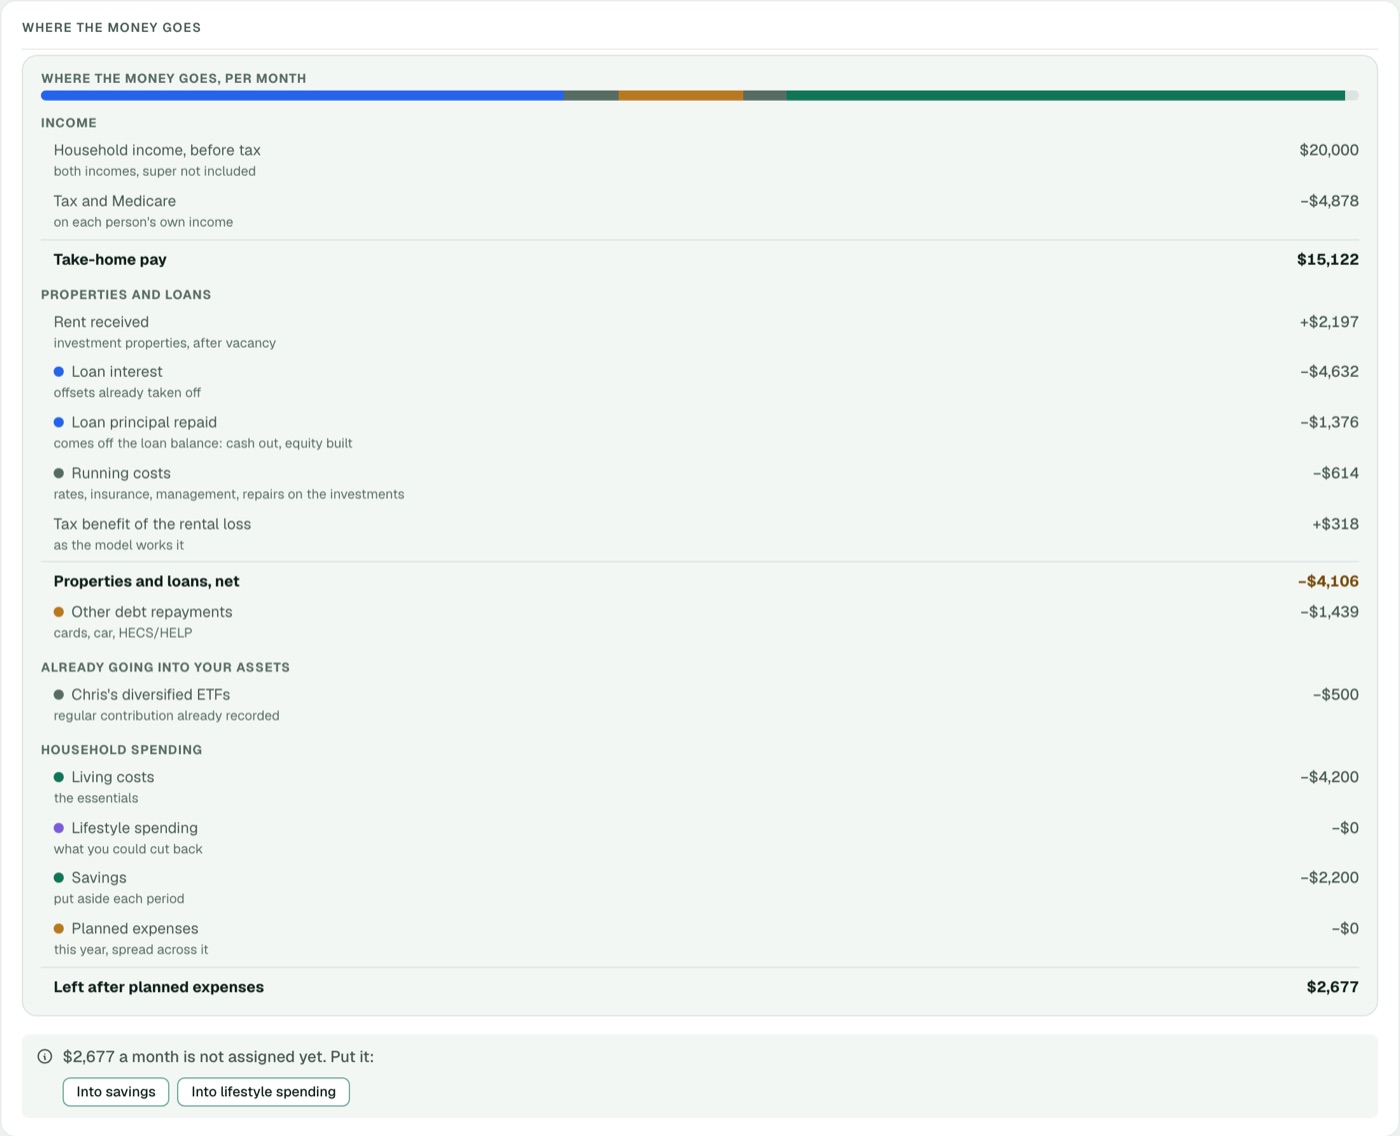
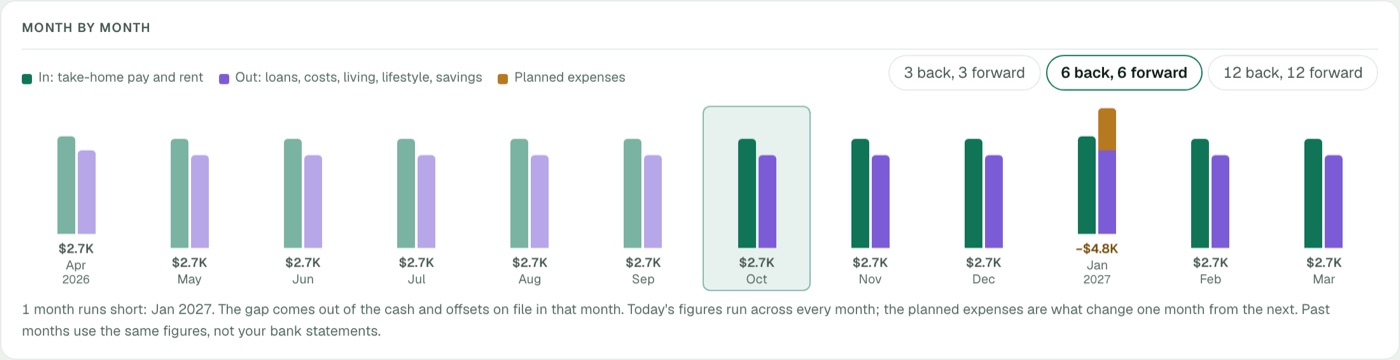
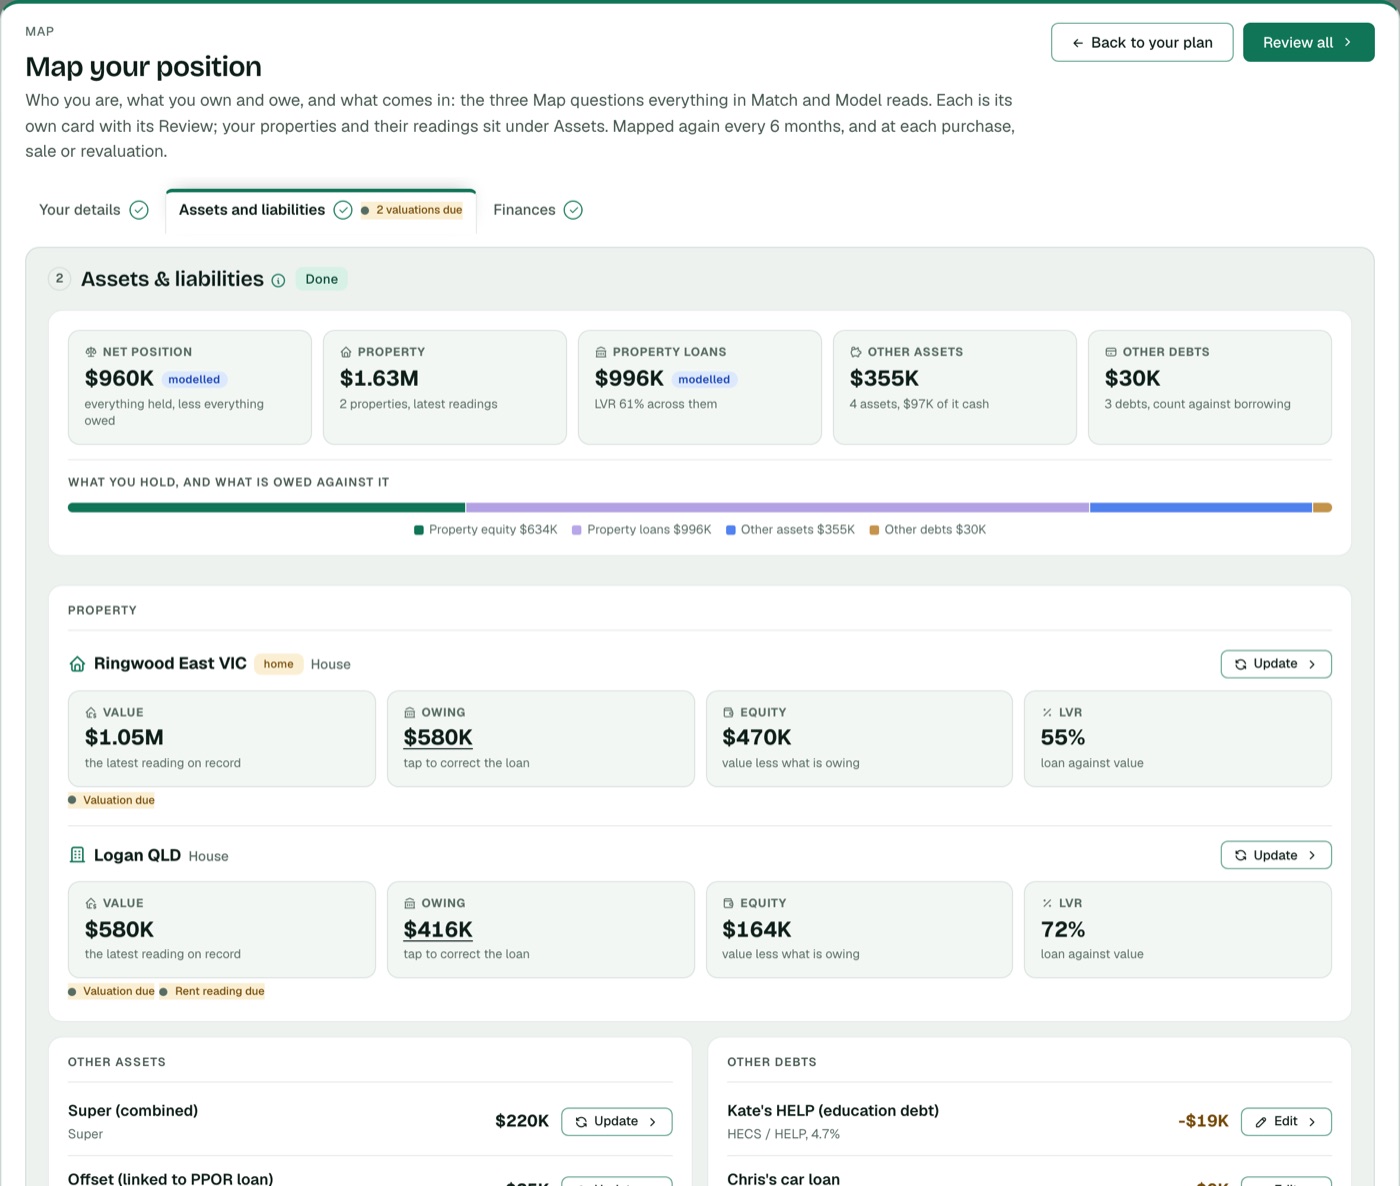
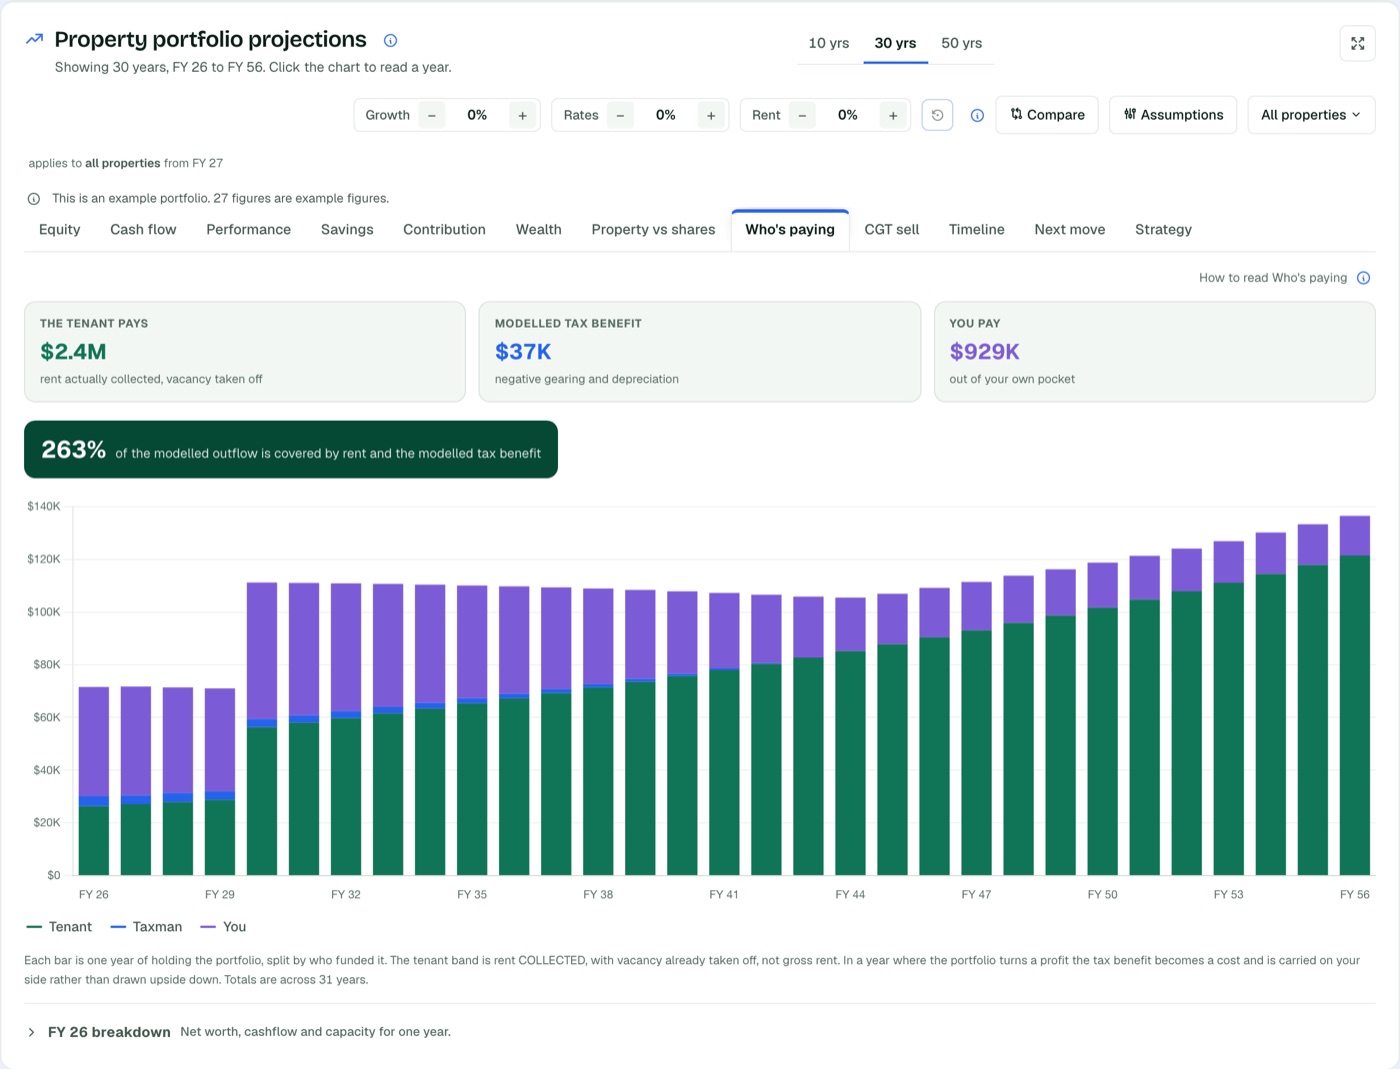
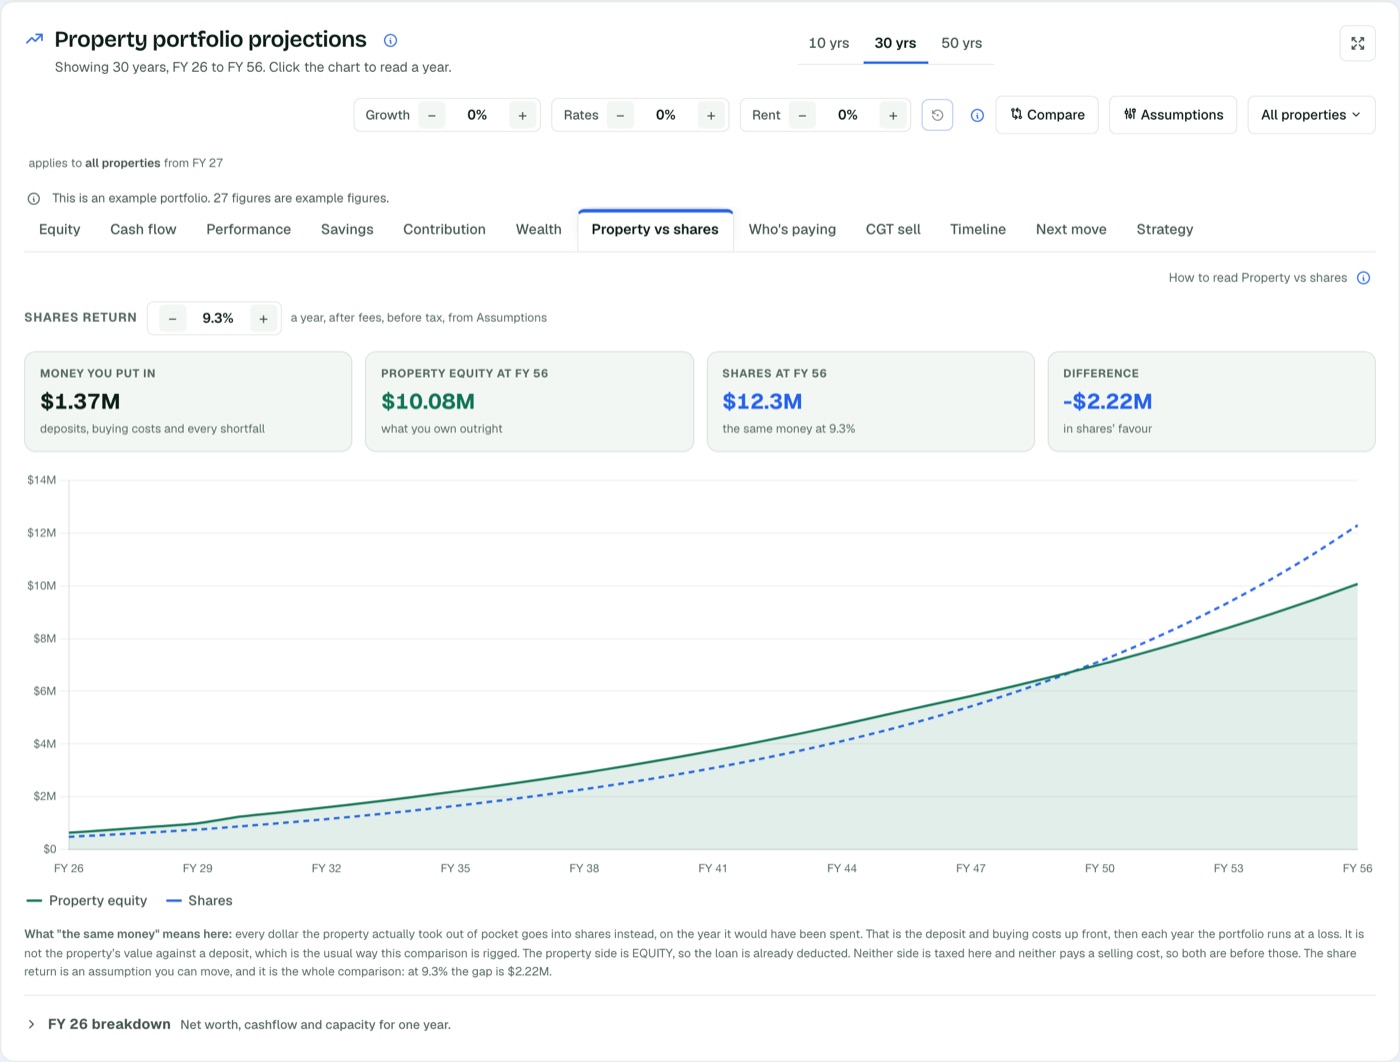
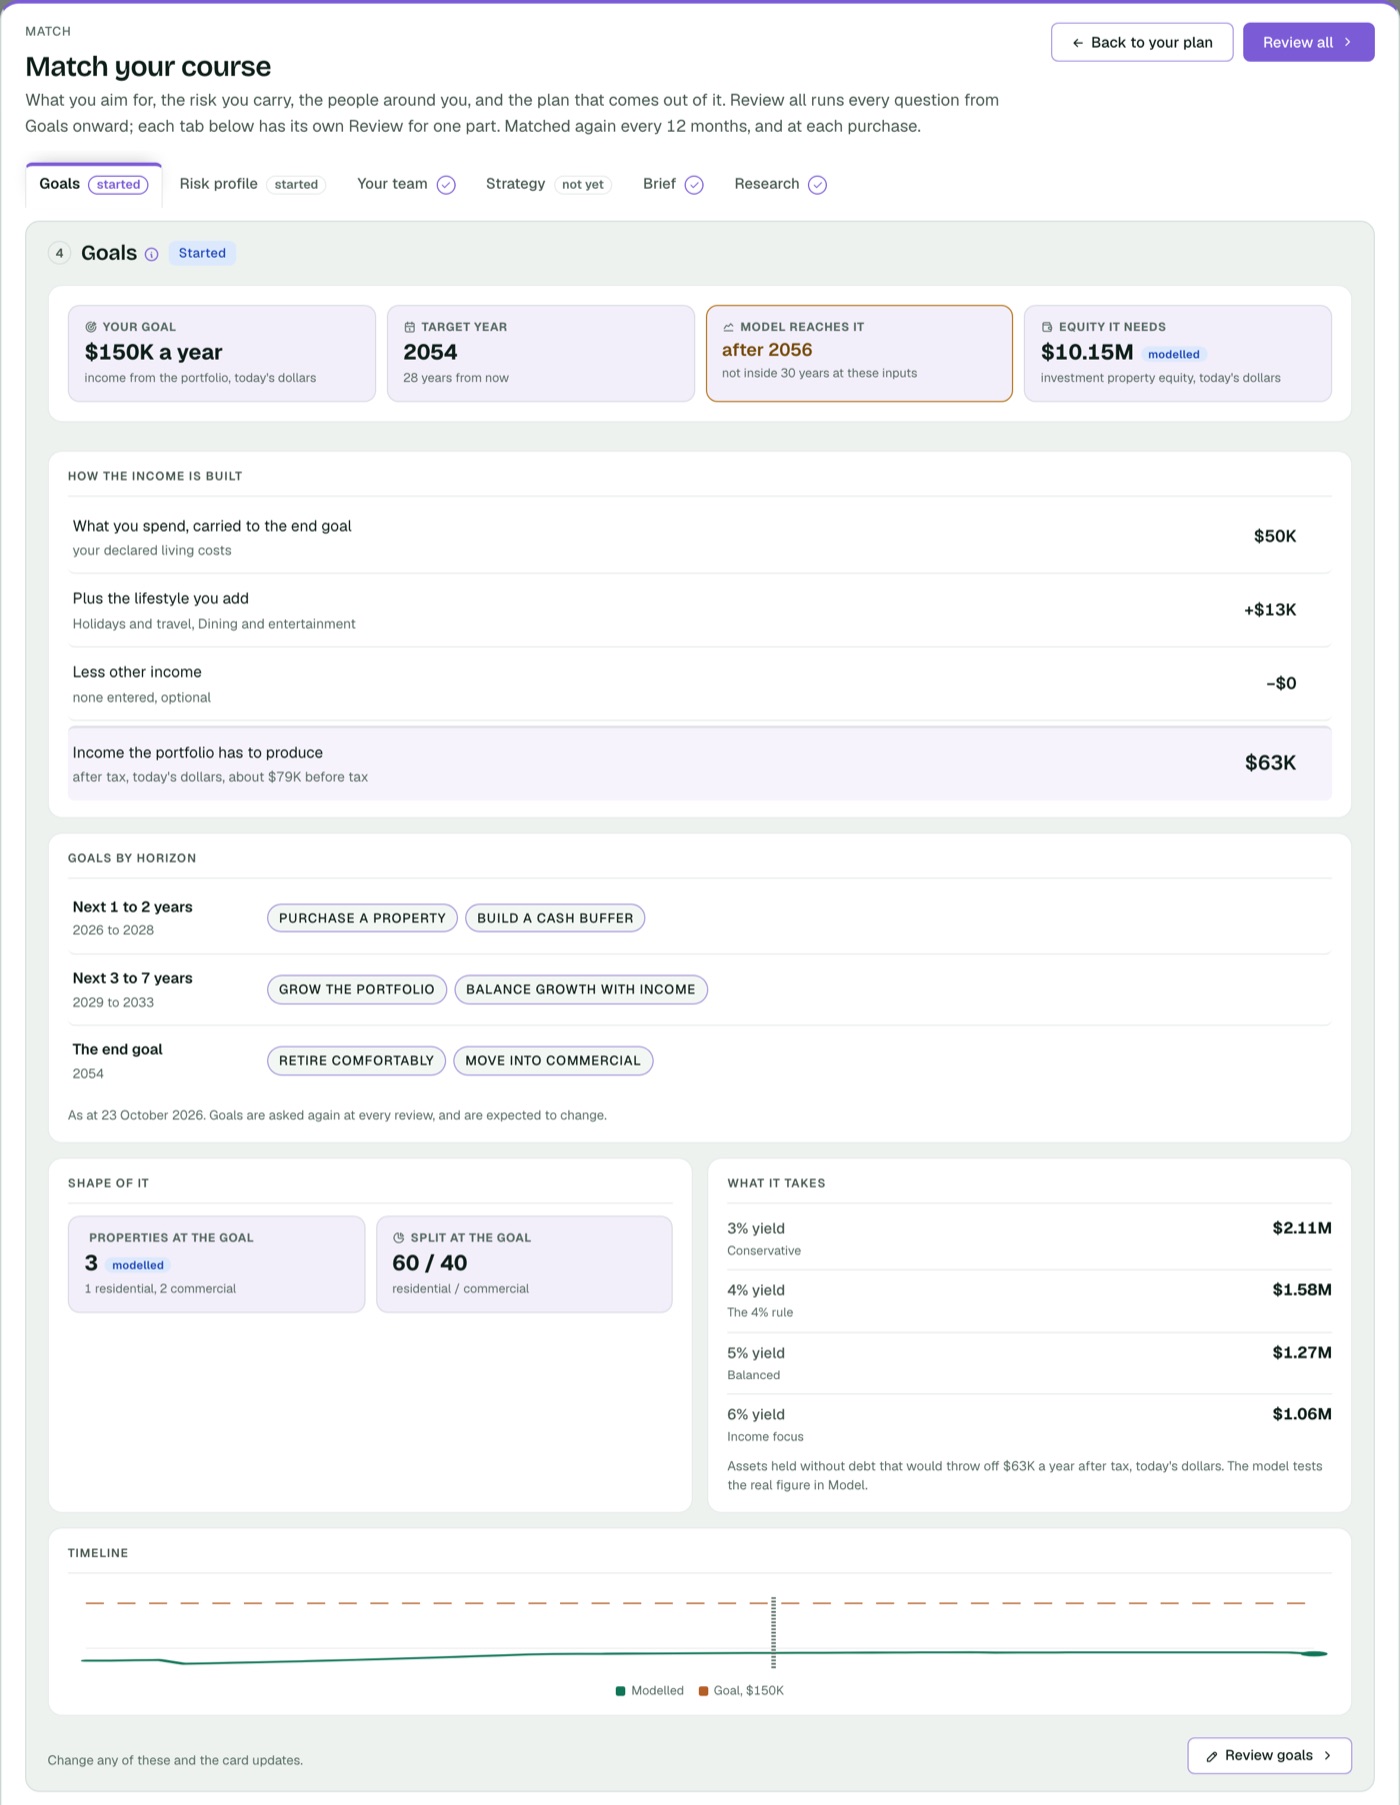
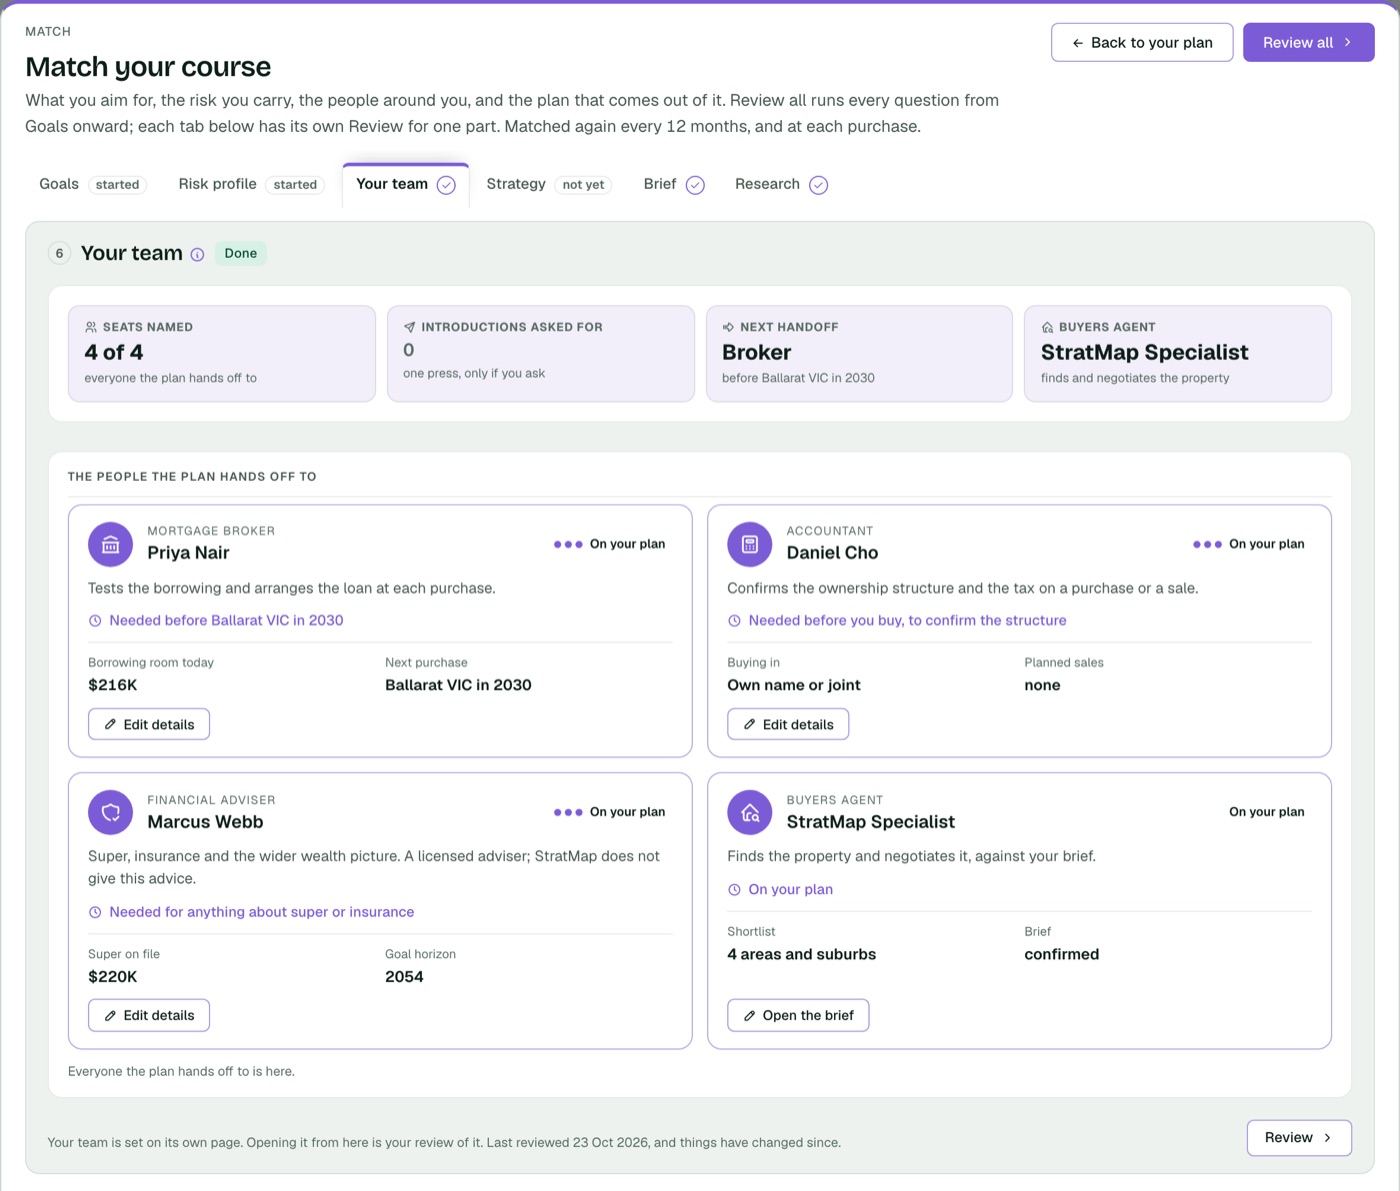
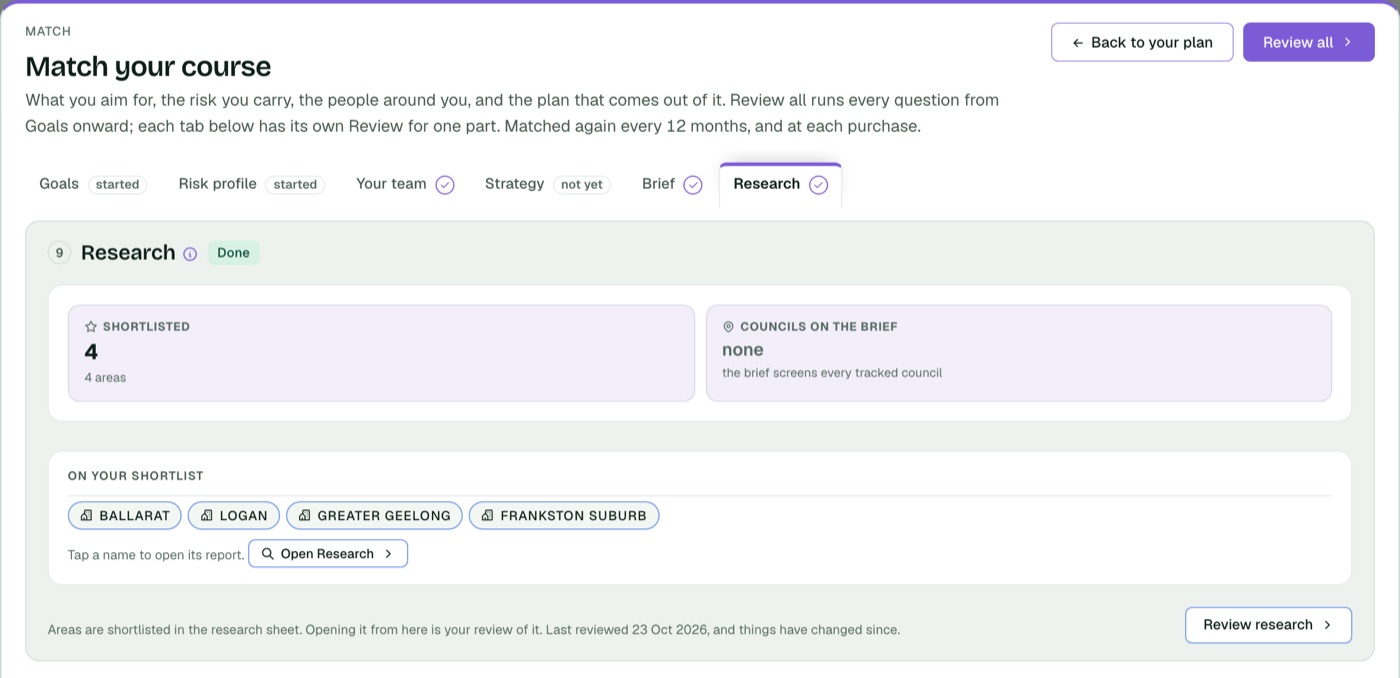
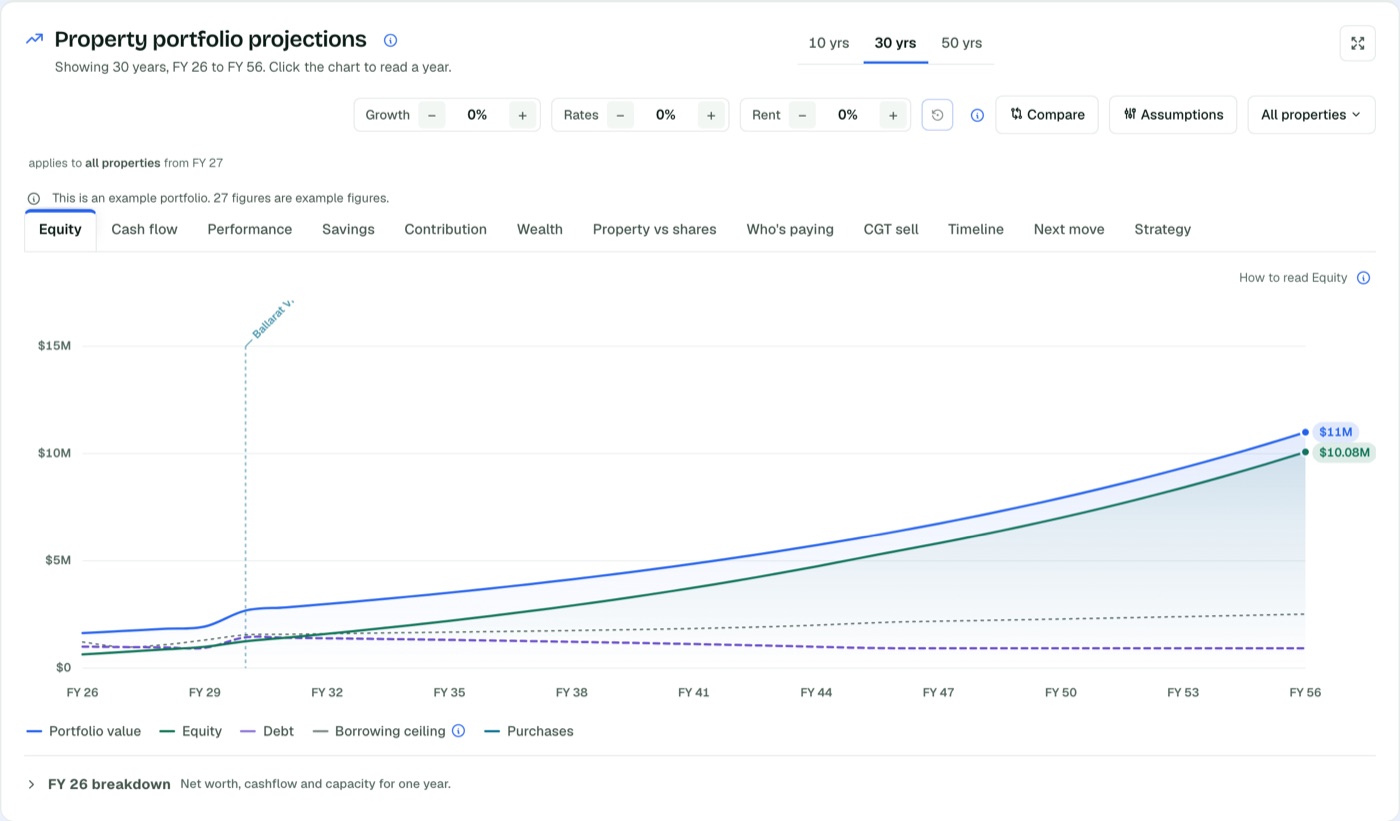
Every picture on this page is the live tool running the example household, Chris and Kate: two incomes, a home, an investment property, a baby on the way, a car loan, a card, HELP, shares and super.

Your real portfolio. Valuations, rent and loan balances, with every change updating the record. Mapped again every six months.
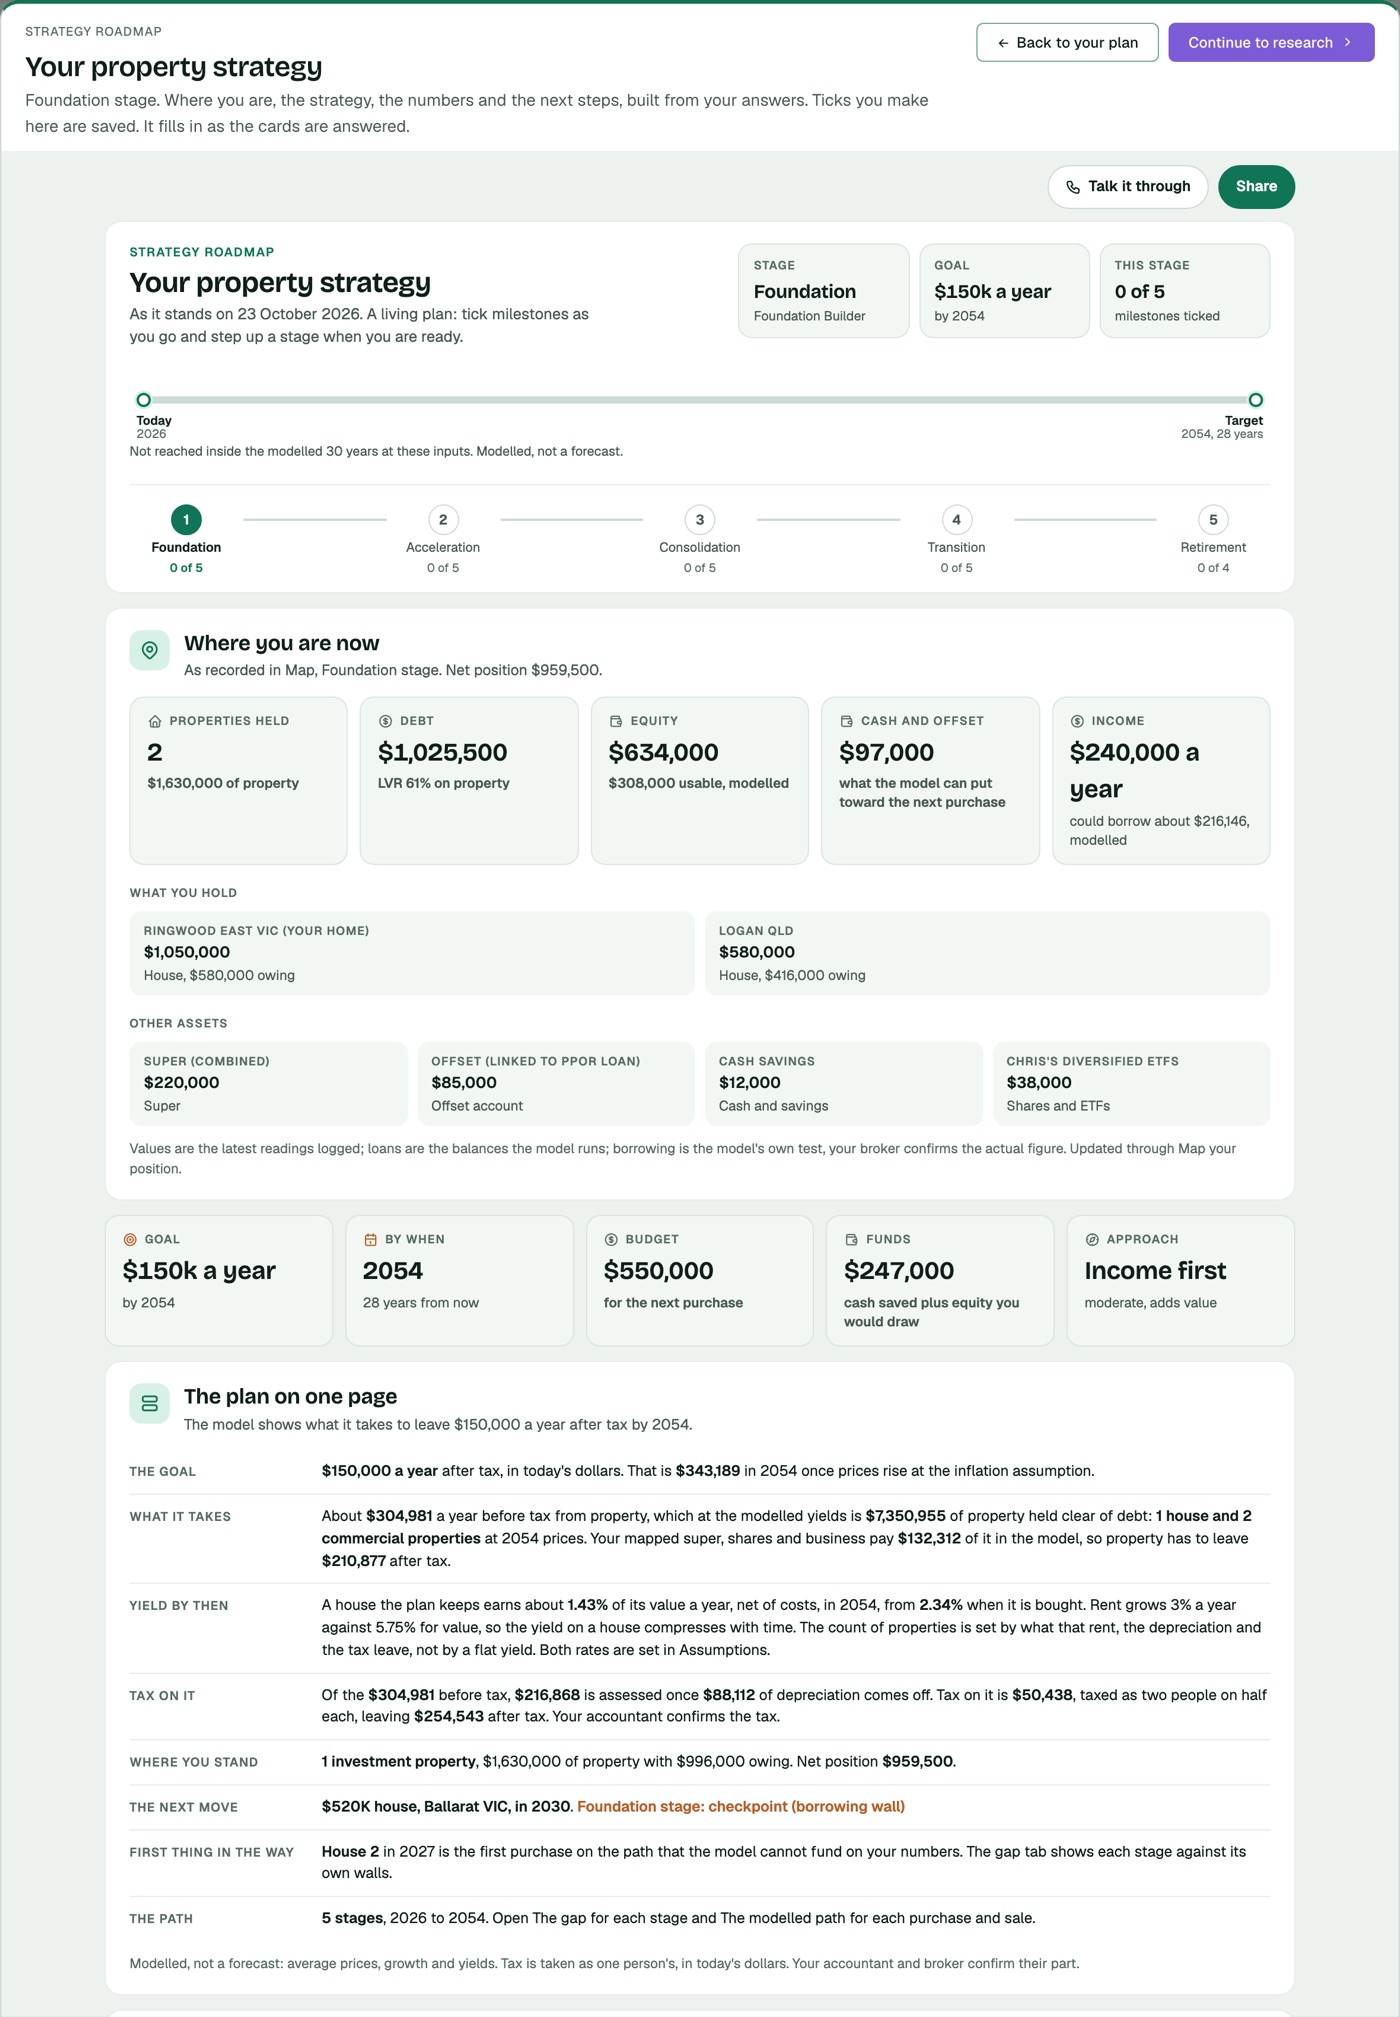
Goals, risk, team, strategy and brief, asked after you see your own numbers. Matched again every twelve months.
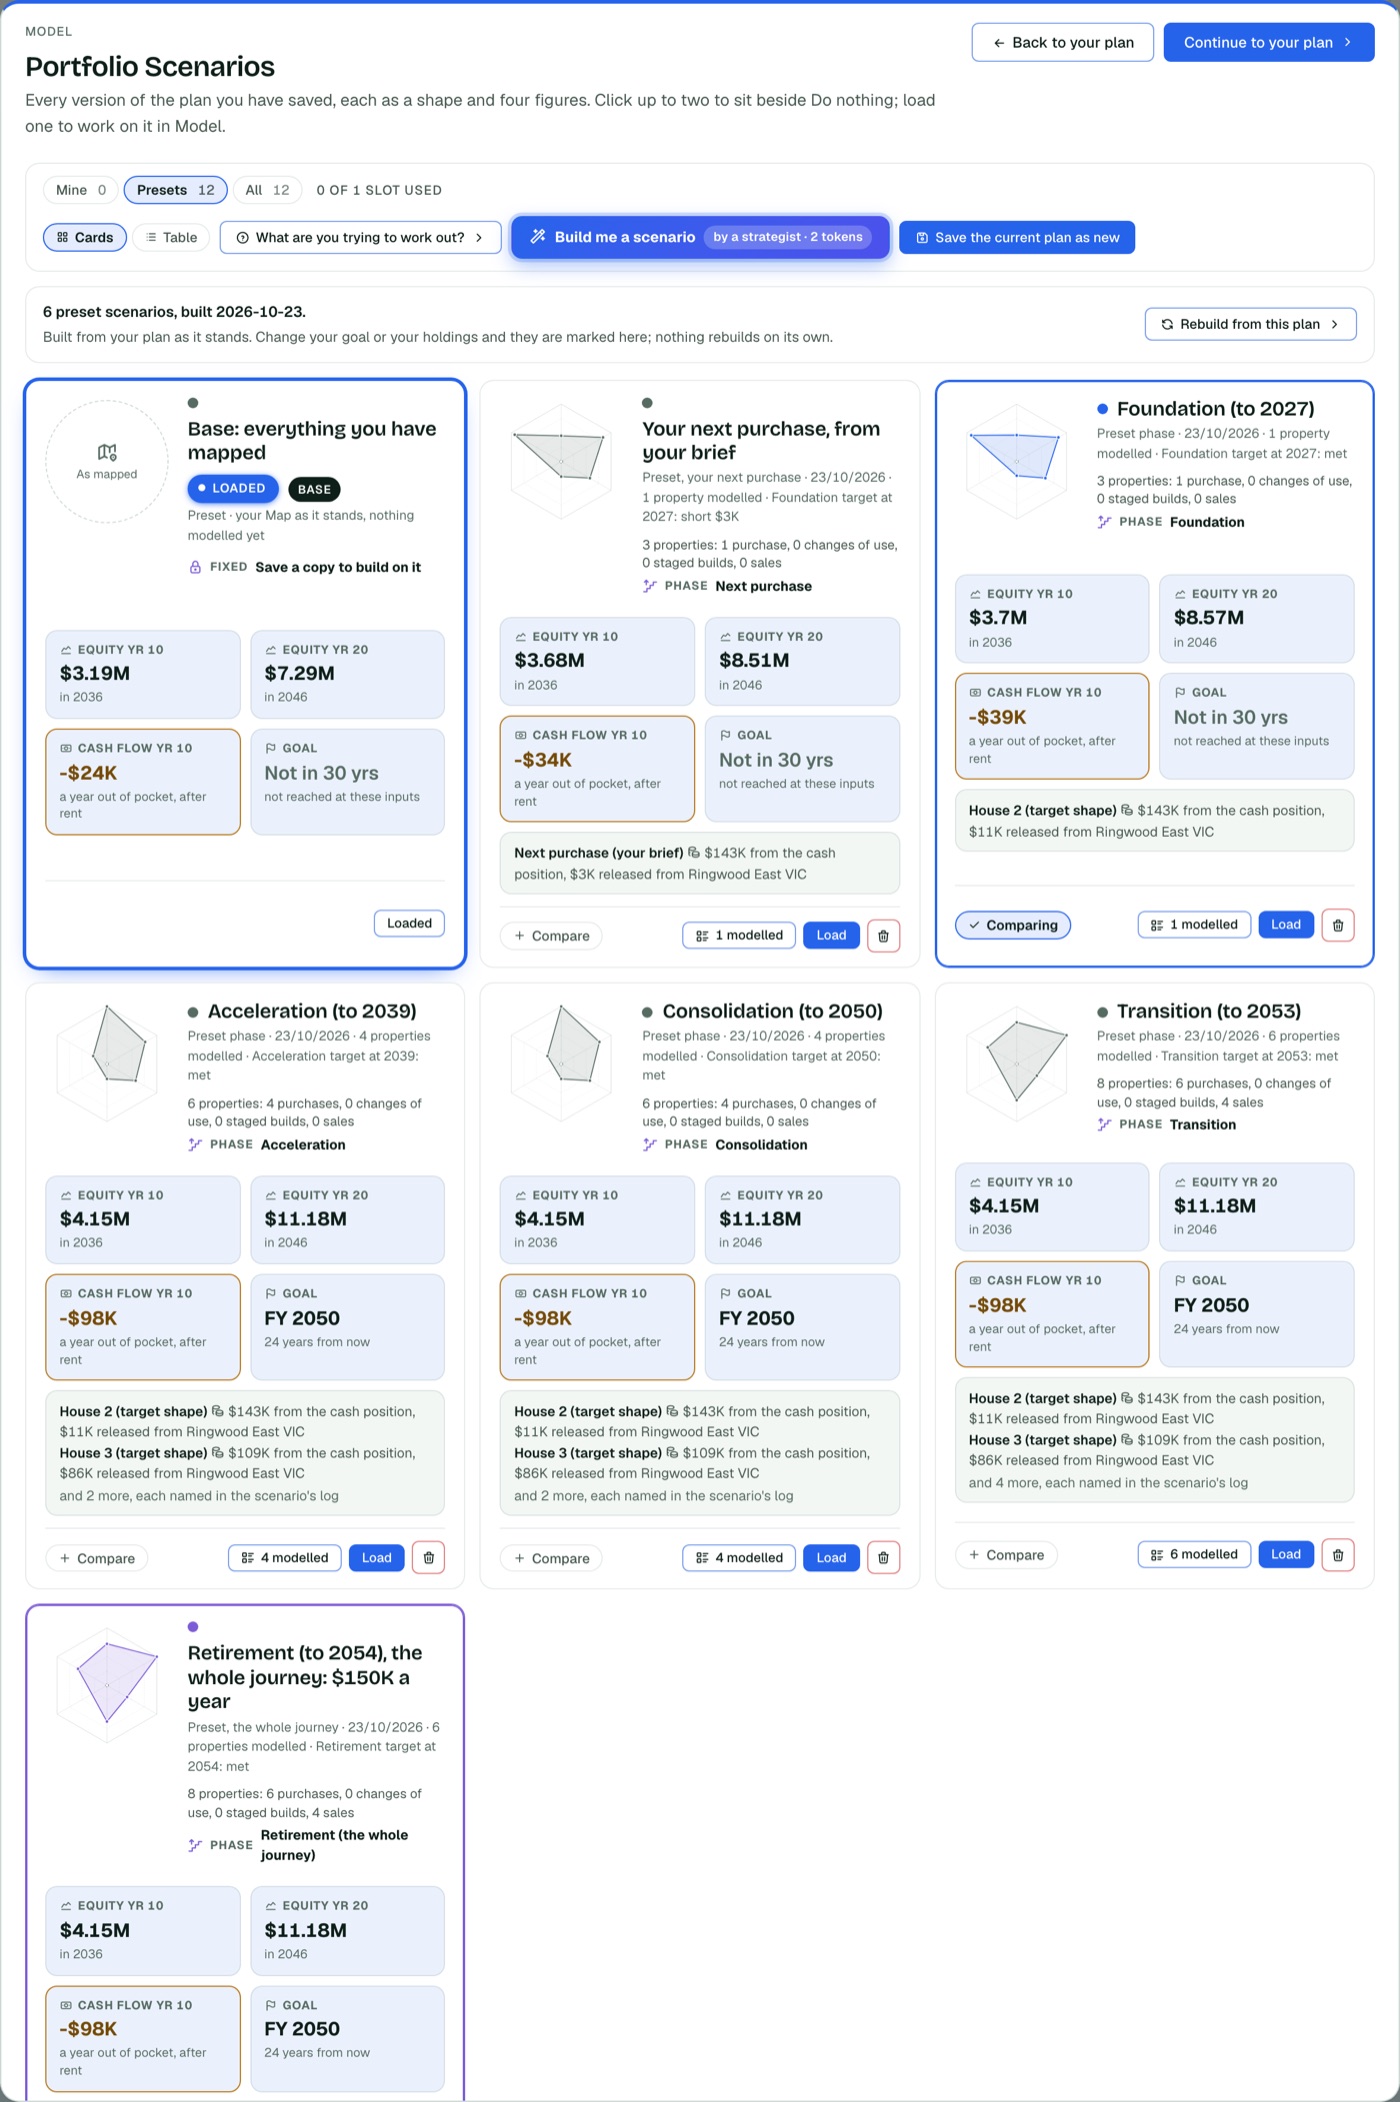
Build scenarios without touching the record, compare them side by side and see the year your goal lands at your inputs.
Enter what you own and owe, your income and your spending. The tool builds one record the rest of the product reads, and shows where the money goes without double counting.


Change an input and every tab redraws. Stamp duty for all eight jurisdictions, depreciation, the borrowing test and the 2026 reforms are coded, not averaged.


Test a purchase, a sale, a build, a change of use or a commercial entry as a scenario, without touching your record.

The tool shows the deposit, the borrowing test and where a plan sticks. It does not tell you what to buy, and it hands the lending, tax and structure questions to the people who own them.


Match turns what you told the tool into a brief, a shortlist and a plan. The questions are asked once you have seen figures of your own, and again at every review.


Search any Australian suburb. Suburbs with too few sales to be reliable are deliberately left out: if we cannot back a number, we do not show it. Enterprise-level data, shown with its date.

The tool explains itself, and it keeps your record current at a pace you can keep.
Ask how a number was worked out or where something lives. It answers from the tool's own explainers and points to the screen. It models and explains, and it never gives advice.
Walk through the Map and Match questions one at a time. Each answer is written to the same place the pages edit, so nothing is entered twice.
Map every six months: valuations, rent and loan balances. Match every twelve months: goals, brief and team. Re-asked at each purchase or sale.
Encrypted and hosted in Australia, visible only to you. We never sell your details.
Your income, what you own and owe. About a minute, and everything after the first screen is optional.
Equity, cash flow, the borrowing test and the year the deposit is covered, from your figures, not averages.
Add a purchase or a sale as a scenario, compare it with the plan as it stands, and take the result to your broker or accountant.
Usable equity is 80% of a property's value less the loan on it. For a home worth $1,050,000 with a $580,000 loan that is $260,000 (0.8 x $1,050,000 less $580,000). StratMap reads this from your own figures and shows it beside your cash and the borrowing test. Your broker confirms what a lender will release.
As announced in the 2026-27 Budget, the limit applies to established residential property acquired after 12 May 2026 from 1 July 2027, with losses carried forward and new builds exempt. StratMap models the quarantined loss and shows the result as arithmetic. Your accountant confirms how the rules apply to you.
As announced, the 50% discount is replaced with cost base indexation and a 30% minimum tax from 1 July 2027, with a split for property held before that date: the old rules to the cutoff and the new rules after. The capital gains tab shows the same sale under each method. Your accountant confirms the treatment.
The model assesses income with rent shaded to 80%, less running costs, tax and living costs, with every loan at its rate plus 3 points. That is the model's test, shown as numbers. Your broker confirms the figure a lender will use.
A spreadsheet holds numbers. It does not re-model 30 years of tax, borrowing and capital gains every time one input changes, across eight state duty schedules and each owner's own tax. StratMap does, and you cannot break it.
No. StratMap models and shows the arithmetic. Your accountant owns tax, your broker owns lending, and a licensed financial adviser owns anything to do with super, shares or insurance. The tool is built to make those conversations sharper, not to replace them.
It is free to start: the tracker, the projection engine, the calculators, one saved scenario and a free preview of every report. A yearly plan ($79 a year for the first 1,000 members, then $99) adds more scenarios and deeper tools, and Elite ($199 a year) adds a yearly strategy session with James. See the pricing page for the current figures.
Composite illustration: the same $95k deposit modelled three ways, side by side, at identical growth, loan and rent assumptions. The $1.9M figure is the modelled year 10 equity at those inputs, not a forecast.
Composite, not one individual clientComposite illustration: a $147k modelled 10-year difference in after-tax holding costs between two new builds and two established purchases, shown as arithmetic under the rules as announced and not as a reason to choose either, at the assumptions used. An accountant confirms treatment.
Composite, not one individual clientComposite illustration: three sell-down and hold scenarios modelled side by side, then handed to an accountant to interpret.
Composite, not one individual clientFree to start. Nothing to install. Sign up and your data is saved to your account. We never sell it. Book a strategy session only if the numbers make it worth a conversation.
Get my tracker First 1,000 members lock $79 a year while subscribed. Elite is $199 and includes a yearly session with James